Why your @defer block still shipped in the main bundle
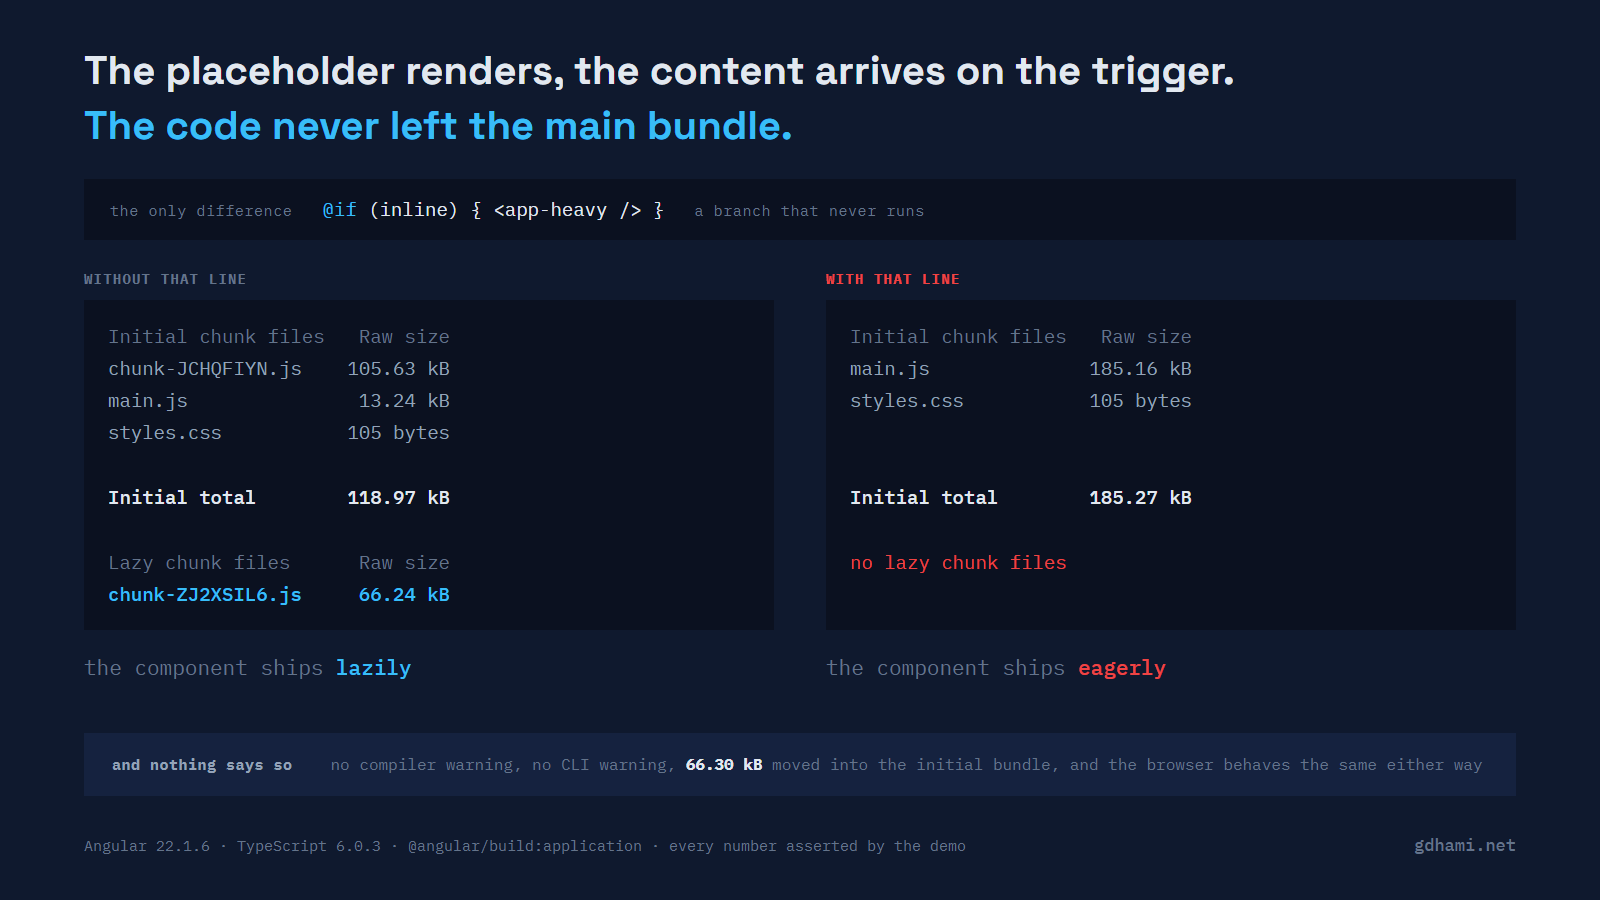
A screen has one expensive thing on it, a table with a few hundred rows and its own filtering, so you wrap it in @defer, give it a placeholder and trigger it when the user asks for it. The build log shows a lazy chunk, the placeholder renders, the table appears on the click. I went looking at this after one of my own @defer blocks turned out to be splitting nothing at all, and what struck me was how little there was to notice.
@defer decides whether a dependency can be lazy at compile time, from how the rest of the file refers to it. The Angular guide states the conditions plainly:
@defer blocks.@defer blocks within the same file. If they are referenced outside the @defer block or referenced within ViewChild queries, the dependencies will be eagerly loaded.Nothing fails when a condition is not met. The block still compiles, the placeholder still renders, and the content still arrives when the trigger fires. What changes is the part you cannot see from the browser: the component's code is in the initial bundle, and the @defer block is picking it up from there.
imports: [HeavyComponent],
template: `
@defer (when open()) {
<app-heavy />
}
`,
})
export class Shell {
readonly heavy = viewChild(HeavyComponent);}
What the compiler emits
A @defer block compiles down to, among other things, a dependency resolver: a function the runtime calls when the trigger fires, which hands back the classes the block needs. Two builds that differ by one line of template produce two versions of it. This is from the minified output, spaced out for reading, so the names are the optimizer's rather than mine.
// the clean block
var We = () => [import("./chunk-ZJ2XSIL6.js").then(i => i.HeavyComponent)];

// the same block, with the component also used elsewhere in the file
var Fg = () => [In];
In is the component class, defined a few hundred lines up in the same file. Both resolvers are awaited the same way, by Promise.allSettled(dependenciesFn()) in the runtime, which is why the timing still looks right: the second one settles on a microtask instead of a network request, and then the block renders exactly as before.
The CLI's build log tells the same story more bluntly, because the whole "Lazy chunk files" section disappears. The clean build:
Initial chunk files | Names         |  Raw size | Estimated transfer size
chunk-JCHQFIYN.js   | -             | 105.63 kB |                31.95 kB
main.js             | main          |  13.24 kB |                 4.37 kB
styles.css          | styles        | 105 bytes |               105 bytes

                    | Initial total | 118.97 kB |                36.42 kB

Lazy chunk files    | Names         |  Raw size | Estimated transfer size
chunk-ZJ2XSIL6.js   | heavy         |  66.24 kB |                 3.77 kB
And the same block with one more reference to the component in the same file:
Initial chunk files | Names         |  Raw size | Estimated transfer size
main.js             | main          | 185.16 kB |                39.30 kB
styles.css          | styles        | 105 bytes |               105 bytes

                    | Initial total | 185.27 kB |                39.40 kB
Seven builds of the same block
I built the same deferred component seven ways, changing only how the shell around it refers to the class. The component renders a marker string that appears exactly once in the source tree, so a script can grep the output files and say which one holds it. It also carries a 480-row generated table, to make the difference big enough to read in the CLI's own numbers.
The "initial JS" column is computed from the output rather than read off the CLI's table: main.js is the entry point, every file reachable from it through a static import is initial, and a file reachable only through import(...) is lazy.
                                                lazy chunk   marker in       initial JS
clean @defer                                      66,244 B   lazy chunk         118,869
the class also used outside the block                 none   initial bundle     185,161
viewChild(HeavyComponent) as the locator              none   initial bundle     194,630
viewChild('heavyRef'), a string locator           66,244 B   lazy chunk         129,176
the class in type position only                   66,244 B   lazy chunk         118,990
the class stored in a field                           none   initial bundle     184,543
an eagerly loaded sibling file imports it            94 B    initial bundle     186,028
The eager rows differ from each other by a few kilobytes because each shell carries its own extra code, a query in one case and a registry field in another. That variation is not the point. The gap that matters is between the first row and the second: one extra <app-heavy> in a branch that never runs moves 66,244 bytes out of a lazy chunk and into what every visitor downloads before the page is interactive.
Worth saying about the size: the generated table is repetitive filler, so it compresses far better than real code, and the CLI's estimated transfer size only grows by about 3 kB against 66 kB of raw growth. In an app where the deferred component is real code, the two numbers move together much more closely.
The reference that broke it in row two is not a live one. The relevant part of the template reads:
@if (inline) {
  <app-heavy />
}

@defer (when open()) {
  <app-heavy />
} @placeholder {
  <p>Rate table not loaded yet.</p>
}
inline is a field that is never set to true, so that branch renders nothing on any run. The compiler is not asking whether the reference executes. It is asking whether the class is used as a value anywhere in the file other than the component's own imports array and the @defer block, and here it is.
Row six is the one I would most expect to walk into by accident. It is not a template reference at all, just the class kept as a value:
readonly panels: readonly Type<unknown>[] = [HeavyComponent];That is the shape a dynamic host keeps when it maps an id onto a component. It is a value use in the class body, and the compiler treats it the way it treats the template use in row two: the resolver in that build is Lg=()=>[En], and there is no import( anywhere in its main bundle.
The reference that does not matter
Row five is the useful contrast. The class is named twice in the shell, and both times in type position:
private lastShown: HeavyComponent | null = null;

remember(instance: HeavyComponent): void {
  this.lastShown = instance;
}
The chunk is still there, byte-identical to the clean build's. TypeScript erases both of those, and the compiler's question is about value uses (in the template, as a query locator, or as an expression in the class body) rather than about the class name appearing in the file. So the rule is narrower than "don't mention it twice", which is a relief, because a deferred component you can never name in a type annotation would be painful to work with.
The lazy chunk that is 94 bytes long
Row seven is the one that changed how I check this. The @defer block in that shell is as clean as row one. The extra reference lives in a different file: an eagerly loaded sibling component that also lists the same component in its own imports. The guide's condition is written per file, and per file this file passes.
Initial chunk files | Names         |  Raw size | Estimated transfer size
chunk-EK3VK4BL.js   | -             | 172.27 kB |                35.80 kB
main.js             | main          |  13.76 kB |                 4.51 kB
styles.css          | styles        | 105 bytes |               105 bytes

                    | Initial total | 186.13 kB |                40.41 kB

Lazy chunk files    | Names         |  Raw size | Estimated transfer size
chunk-37RWS6C2.js   | heavy         |  94 bytes |                94 bytes
There is a lazy chunk named heavy, the compiler did emit a real import(...) for it, and it contains this:
import{J as a,K as b}from"./chunk-EK3VK4BL.js";export{a as HEAVY_MARKER,b as HeavyComponent};Ninety-four bytes of re-export, pointing back into a chunk the browser has already downloaded. The compiler did its part and produced the dynamic import; the bundler then had a module that something eager also needed, and put it where both could reach it. Everything in the build log looks like success. If your check for this has been "is there a lazy chunk named after my component", that is the case that beats it. The guide documents a close relative under "Barrel files and lazy chunks": import the component through an index.ts and it stays in the main bundle. Row seven needs no barrel, only a second eager importer.
Nothing warns you
None of the seven builds printed a warning, at the default production settings or with optimization turned off. That surprised me enough to go looking in the compiler, because Angular usually has a diagnostic for this kind of thing, and it does: @angular/compiler-cli 22.1.6 carries NG8012 for a pipe used eagerly, NG8013 for a directive or component, and NG8014 for the import declaration itself. NG8013 reads, verbatim from the bundle:
NG8013: Element 'app-heavy' contains a component or a directive that was
imported  via `@Component.deferredImports`, but the element itself is located
outside of a `@defer` block in a template. To fix this, either use the
'app-heavy' element inside of a `@defer` block or import referenced
component/directive dependency using the `@Component.imports` field.
All three are tied to @Component.deferredImports, a field the compiler reads but the public Component type does not declare, so the demo has a probe that writes that field out by hand to see what happens. It does produce NG8013. It also produces this:
TS2353: Object literal may only specify known properties, and 'deferredImports'
does not exist in type 'Component'.
deferredImports is not on the public Component type. I checked the published declarations for v17, v18, v19, v20, v21 and v22 and the string does not appear in any of them, and the API reference page for Component does not list it either. The compiler reads it; the typings do not admit it. So the path that gets you a clear error is one you cannot take in a normal strict Angular project without suppressing a TypeScript error first, and the path everyone actually uses, plain imports, says nothing at all.
Checking your own build
The check that survives all seven cases is to look for the code rather than for the chunk. Pick a string that exists nowhere but the deferred component, build, and see which file has it:
ng build
grep -rl "HEAVY_PAYLOAD_MARKER_5K7QW2" dist/clean/browser/*.js
# dist/clean/browser/chunk-ZJ2XSIL6.js

grep -rl "HEAVY_PAYLOAD_MARKER_5K7QW2" dist/template-outside/browser/*.js
# dist/template-outside/browser/main.js
If that prints a chunk the entry point does not statically import, the deferral happened. If it prints main.js, or a chunk listed under "Initial chunk files", it did not. A class name can work as the needle, but the optimizer is free to rename it, so a string literal the component renders is the safer choice. ng build --stats-json writes an esbuild metafile next to the output if you would rather read the module graph than grep it.
Two habits that have kept me out of this. Give a deferred component its own file and let the deferring template be the only thing that names it, which turns the per-file condition into something you can see at a glance. And when you do need a handle on the rendered instance, reach for a template reference variable rather than the class. A string locator keeps the class out of value position, and a reference variable on a component tag resolves to the component instance, so the class can still be the type argument, which is erased like row five's:
// <app-heavy #heavyRef /> inside the @defer block
readonly heavyRef = viewChild<HeavyComponent>('heavyRef');
That is row four. Its lazy chunk is the same size to the byte, 66,244 bytes, and differs from the clean build's only in its import line from the shared chunk, whose hashed file name also changes because that chunk now carries the query code. The initial bundle is about 10 kB larger than the clean variant's, which is the query machinery and the extra binding, not the deferred component.
The demo is at github.com/gdhami-net/defer-bundle-demo. npm run check builds all seven variants, asserts where the marker string landed in each, and runs the probe that fails on purpose; then seven tests mount every shell with DeferBlockBehavior.Playthrough and assert that the placeholder renders first and the content renders on its trigger, which is why nothing you can see in the browser gives the eager case away. Angular 22.1.6, TypeScript 6.0.3, @angular/build 22.1.8 and the @angular/build:application builder, on Node 26.1.0 under Windows. The runtime half runs in jsdom rather than a real browser, and I have not repeated any of it on Linux.